Cannabiz Media
cannabis market trends

BDSA talks seasonal sales strategies, consumer behavior, and how to win at cannabis retail

A high-level understanding of cannabis markets is key for any business looking to succeed in the industry. But as legal markets mature, those in the highly competitive cannabis retail space need a more detailed view of market trends to stay ahead of the curve. Granular knowledge of market-level sales data, consumer behavior, and transaction-level data can help businesses make informed decisions in the often-unpredictable cannabis retail space.

BDSA’s new Basket Analytics product gives a comprehensive view of per-transaction purchasing dynamics. Using this transaction-level data analysis, BDSA has identified some of the top trends seen in 2020 and lessons that retailers and brands can draw from how cannabis markets reacted to the challenges of the past year. We’ll also look in more general terms at ongoing growth and consumer behavior.

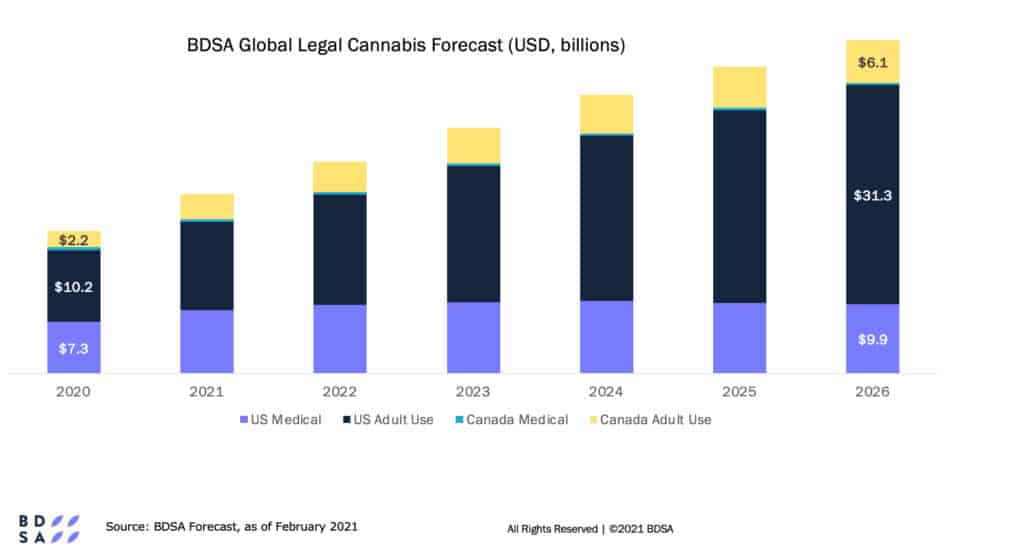
Even with the many disruptions of the past year, the US cannabis market grew to total $17.6 billion in 2020, almost a 50% year-over-year increase in sales. While a good deal of this growth is due to new markets coming online, the expansion of the consumer base in existing markets also contributes to significant growth. According to BDSA Consumer Insights data from fall 2020, the share of respondents in Colorado who report consuming cannabis in the past six months grew from 42% in Fall 2019 to 48% in Fall 2020. These new consumers play a powerful role in cannabis markets and tools like BDSA’s Consumer Insights can help executives tailor their products and sales strategy to better target the consumer mix in their respective markets.

global legal cannabis sales forecast

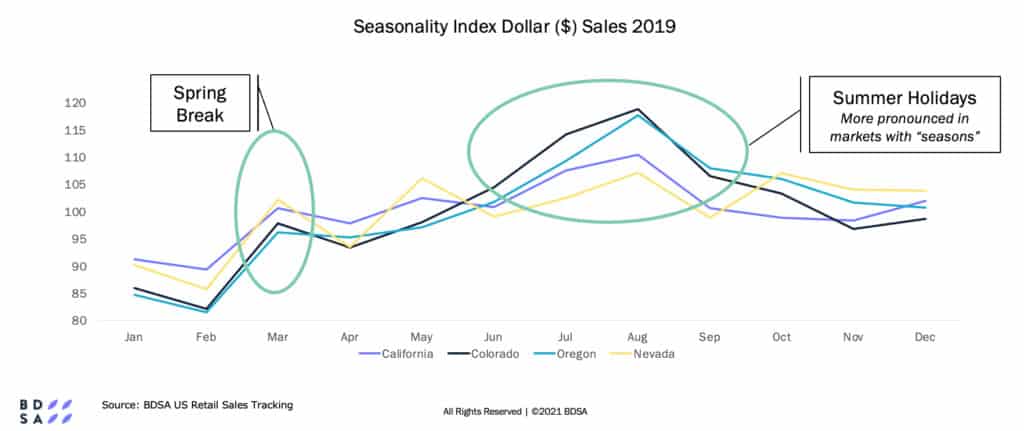
Beyond knowledge of the overall consumer mix in each market, it’s important for industry players to understand when consumers are engaging with their products. Before the disruption brought by COVID-19 in 2020, cannabis markets could be expected to see a jump in sales in March, coinciding with spring break, followed by a larger surge in sales in the summer with monthly sales peaking in the month of August. (Interestingly, this summer sales surge is much more pronounced in states that experience colder winters than in states with more temperate climates such as California and Nevada.)   cannabis sales summer

Within the typical “peak sales” months in the spring and summer are some holidays that historically bring very high daily sales. It’s no surprise that 4/20 leads the pack, with sales typically two to three times the daily average, but even holidays with no particular affiliation to cannabis can spike sales. Sales on Independence Day and Labor Day roughly total 1.3x the annual daily average

COVID-19 and its resulting stay-at-home orders significantly upset the usual trend of seasonality, with sales in the spring especially sluggish compared with past years. However, most states still saw steady growth in monthly sales beginning in June—leading to substantial year-over-year growth, with most adult-use states seeing double-digit growth. 

cannabis market trends

By analyzing basket size, manufacturers and retailers can discern key drivers of growth. For example, between Q4 2019 and Q1 2020, Colorado saw average daily transactions increase by 48% and basket size fall by -11%, which is somewhat expected given how consumers stocked up as COVID-19 lockdowns went into effect. As the year progressed, basket size fell, and daily transactions rose significantly. 


Retailers and manufacturers can build a strategy to cater to this low-basket size, high-transaction volume trend in purchasing behavior. 

For Retailers:

  • Employ marketing targeted at key consumer segments to drive traffic to your store.
  • Use promotional tactics such as bulk discounts to increase basket size. 
  • Ensure that retail spaces are prepared for high traffic.

For Manufacturers:

  • Expand product availability—widespread product availability is a key feature of top-selling brands.
  • Market effectively to drive brand recognition and capture consumer interest in the retail setting.

Basket analysis also gives businesses the tools to identify which product categories see the greatest penetration across baskets and which product categories drive higher basket size. In Q4 2020, concentrates, flower, and pre-rolls had higher basket penetration in Colorado than most other product categories. This is unsurprising, as BDSA Consumer Insights’ data show that inhalables are the most widely consumed and preferred forms of cannabis by Coloradans. 

However, baskets with flower and pre-rolls also had lower basket size than those with concentrates and topicals. This knowledge presents an opportunity for retailers to increase basket size through cross-product promotions that boost sales of high-ticket items or by offering bulk discounts on lower-cost items such as flower and pre-rolls.

Succeeding in increasingly competitive cannabis markets requires manufacturers and retailers to have a dynamic strategy to respond to a growing consumer base and ever-shifting purchasing trends. With a granular understanding of consumer attitudes and transaction-level data, businesses are better equipped to respond to the changing behavior and demands of the modern cannabis consumer. 


Facebook
Twitter
LinkedIn

Leave a Comment

Your email address will not be published. Required fields are marked *

Cannabiz Media
About the Author
Related Articles

Join the List

Subscribe for weekly updates.

We value your privacy.
Scroll to Top